You are viewing archived content
Please note that this page is a static copy of a previously published web page and is no longer actively maintained.
Be aware that the information contained here may be out-of-date.
For the most recent information, we recommend visiting the main website of the European Union Drugs Agency (EUDA).
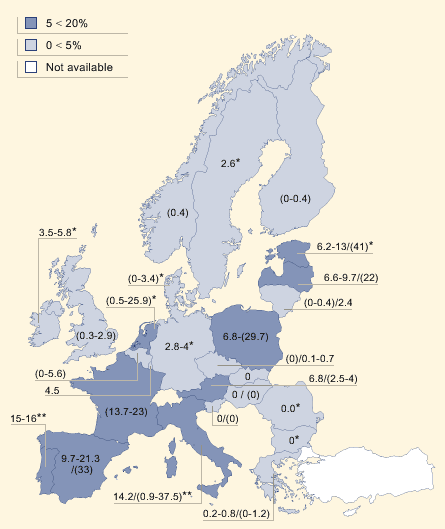
Figure INF-20: Prevalence of HIV infection among injecting drug users, 2002 to 2003

Notes:
Figures in (brackets) are local data. Colour indicates midpoint of national data, or if not available, of local data.
* Data in part or totally before 2002. Lithuania and Norway include data for 2004.
** Data for Italy and Portugal include non-injectors and are likely to underestimate prevalence in injectors