You are viewing archived content
Please note that this page is a static copy of a previously published web page and is no longer actively maintained.
Be aware that the information contained here may be out-of-date.
For the most recent information, we recommend visiting the main website of the EMCDDA.
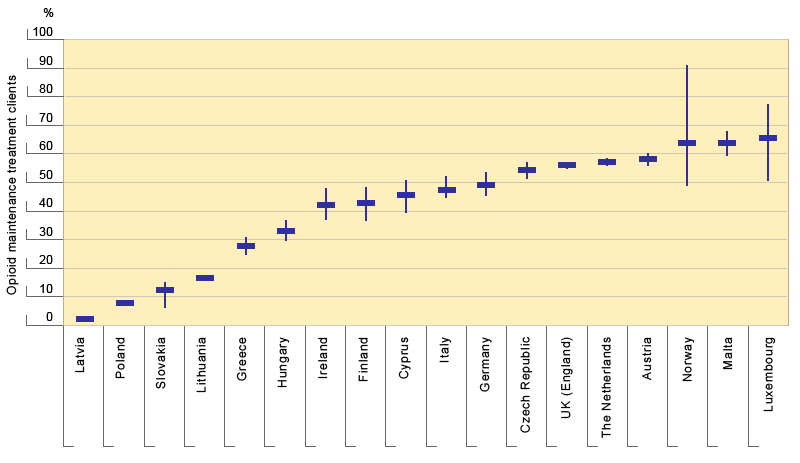
Figure HSR-1. Opioid substitution treatment coverage
Part (i). Opioid substitution treatment clients as a percentage of the estimated number of problem opioid users, 2010 or most recent year available

| Country | High | Low | Central | |
|---|---|---|---|---|
| Latvia | 2 | 2 | 2 | |
| Poland | 7 | 8 | 8 | |
| Slovakia | 6 | 15 | 12 | |
| Lithuania | 16 | 17 | 17 | |
| Greece | 25 | 31 | 28 | |
| Hungary | 30 | 37 | 33 | |
| Ireland | 37 | 48 | 42 | |
| Finland | 37 | 49 | 43 | |
| Cyprus | 40 | 51 | 45 | |
| Italy | 45 | 52 | 47 | |
| Germany | 45 | 54 | 49 | |
| Czech Republic | 51 | 57 | 54 | |
| England | 55 | 57 | 56 | |
| The Netherlands | 56 | 58 | 57 | |
| Austria | 56 | 60 | 58 | |
| Norway | 49 | 91 | 64 | |
| Malta | 59 | 68 | 64 | |
| Luxembourg | 51 | 78 | 66 |
Notes:
The graphic shows the estimated or reported number of opioid maintenance clients as a proportion of the number of problem opioid users, estimated by various methods, in each country with available data.
The symbol indicates a point estimate, a bar indicates an uncertainty interval.
Based on countries' estimates of problem opiate use (POU), estimates or estimates of problem drug use and injecting drug use, where case definitions in the country's estimates correspond to POU.
See the data on number of clients in substitution treatment in Table HSR-3 part (i) .
The problem opioid use estimates can be found in Table PDU-1 part (iii) and Figure PDU-1.
Finland, Poland: data on POU estimates are for 2005 and the latest available estimates of OST clients data are from 2009 for Finland and 2010 for Poland.
Ireland: data on POU estimates are for 2006 and the latest available estimates of OST clients data are from 2010.
Luxembourg, Lithuania: data on POU estimates are for 2007 and the latest available estimates of OST clients data are from 2010.
Netherlands, Hungary, Norway: data on POU estimates are for 2008 and the latest available estimates of OST clients data are from 2010.
Germany, Austria, Spain: data on POU estimates are for 2009 and the latest available estimates of OST clients data are from 2010.
See also 'General notes for interpreting data' on the Explanatory notes and help page.
Sources:
Standard Tables 24 (ST24) on 'treatment availability' Section 3 and Section 5, submitted by NFPs in 2011.
Reitox National Reports, 2011.
| AAA | BBB | CCC | |
| X | 2 | 3 | 4 |
| 1 | 2 | 3 | 4 |
| X | 2 | 3 | 4 |
| 1 | 2 | 3 | 4 |
| X | 2 | 3 | 4 |
| 1 | 2 | 3 | 4 |
abcfigN
